- Transforming digital asset management with AI
- Adding both metric & imperial scalelines to an OpenLayers map
- Populating Google Sheets using Analytics Reporting API v4
- 2020 is the year to upgrade to HTTPS
- How to stay motivated and focused whilst working from home
- Servers: Dedicated or Virtual - What are they?
- MeasureCamp Cardiff 2017 sponsorship
- Content is king, long live the king
Populating Google Sheets with Google Analytics Reporting API v4
Posted on January 22, 2021 by Dave Gough

I have used the older Google Analytics API v3 for years, pulling data into Google Sheets, MySQL and Excel, but it recently started to throw unexplained errors, empty results and timeouts during the fetches.
Migrating to Analytics Reporting API v4 was an obvious step, but I found the documentation lacking. Having got a simple example working, I thought I would share.
This example pulls the data from one Google Analytics account view, using Analytics Reporting API v4 and populates the tabular response into a single Google sheet.
Step by step
First find the View ID for the Google Analytics view you wish to import. You must ensure that your Google user has at least read access for the Google Analytics view.
If you are logged into multiple Google accounts, do yourself a favour, log out of all accounts and log back in only with the account you wish to use… This can save a lot of confusion through the process and gives it the best chance of just working.
The Google Analytics View ID can be found by visiting the Google Analytics account > Admin > View > View Settings:
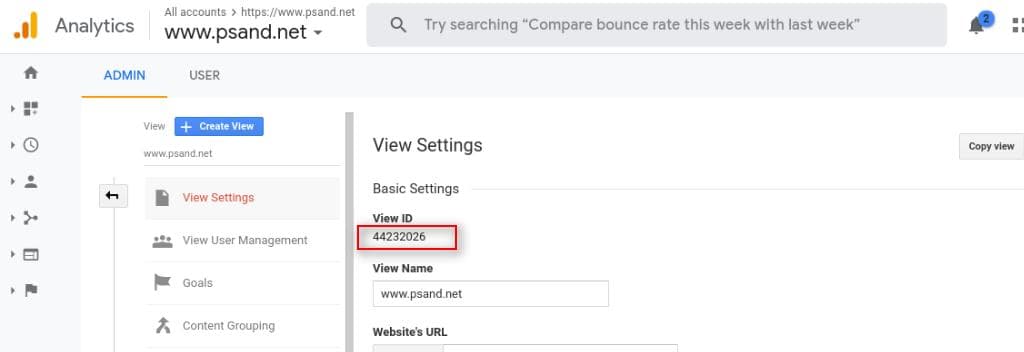
The View ID is also visible in the Google Analytics account URL for the view, following the letter p:

Make a copy of the example Google Sheet:
 https://docs.google.com/spreadsheets/d/1_V3iP3XWJyrTwNG3yZop4u9Yx4H-Qzd2ibsGpe0nYfU/edit#gid=0
Open the Script editor using Tools > Script editor:

In the Script editor code, replace the viewId value with the View ID from the Google Analytics account from which you wish to pull data:
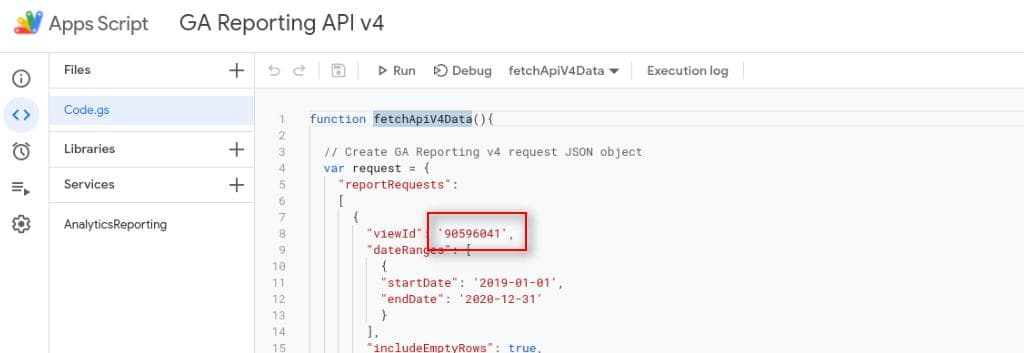
Run the script, using the Run button in the Script editor:

You will be challenged as Authorisation is required. The script needs to use your login credentials to:
- Read the Google Analytics view data
- Write the results to the Google sheet
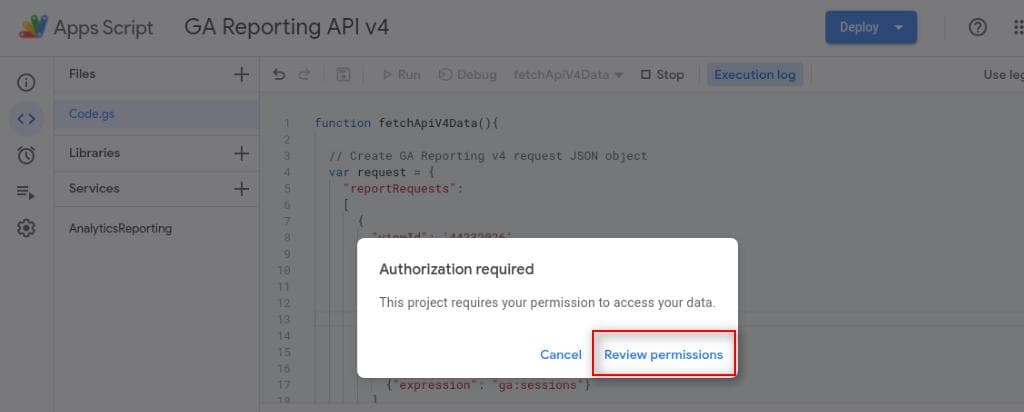
Press Review permissions which will give you a Google window to choose a Google account:
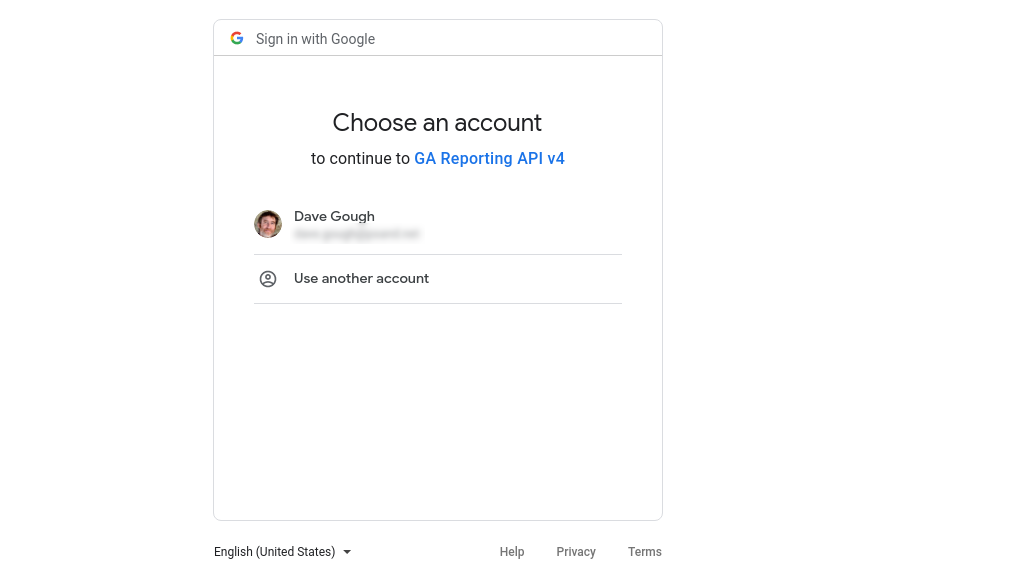
Choose the Google account you wish to use (must have read access to the Google Analytics account view) at which point you should be challenged that you have not verified the app, it should show your Google login account email:

Hit Advanced, you should see a further challenge to ensure the script is trusted to run on your behalf:

Hit Go to GA Reporting API v4 (unsafe)

You should only be authorising to:
- See, edit, create, and delete your spreadsheets in Google Drive
- See and download your Google Analytics data
Hit the Allow button - the Google window should authorise and disappear.
You may at this point get a Security alert email to your Google login email address from Google saying that you have granted access.
If, like me, you've taken too long authorising, back in the Script editor, you may have a message:
Warning This project requires access to your Google Account to run. Please try again and allow it this time.
If this is the case, run the script again in the Script editor:

If the script runs successfully, you should see a stream of JSON output in the Execution log and if you scroll to the bottom, a final message:
Notice Execution completed
Now visit your spreadsheet and you should have one row of headers and 24 rows of data in the sheet named Data:
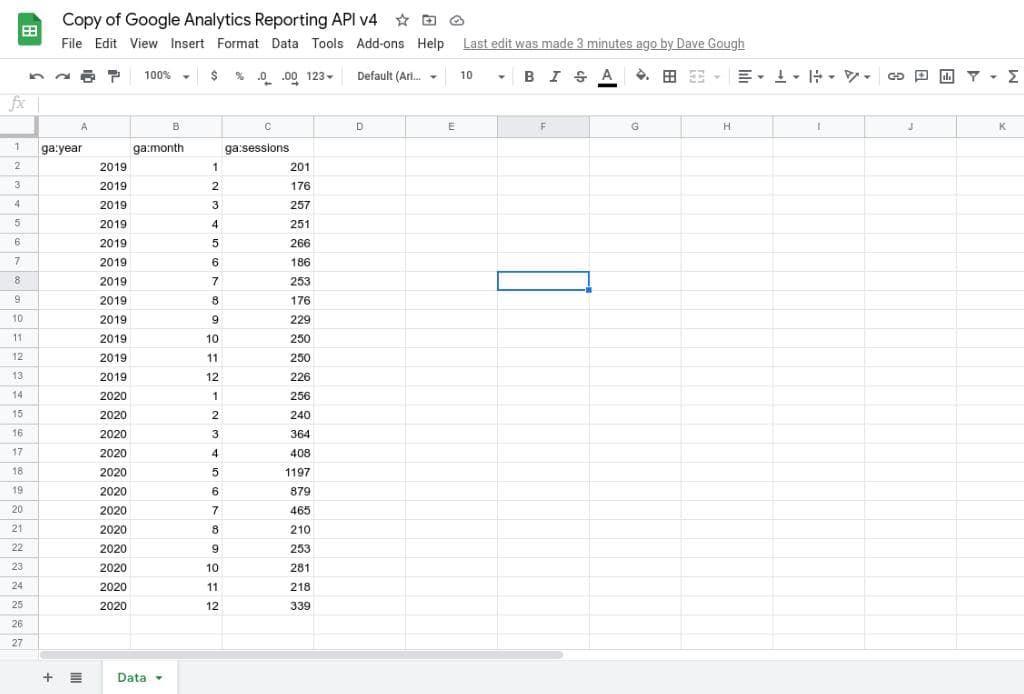
That's it, you now have your data in Google Sheets from Google Analytics. The possibilities for analysis from here are almost endless. Google documentation on creating requests:
Using the Analytics Reporting v4 in your own project
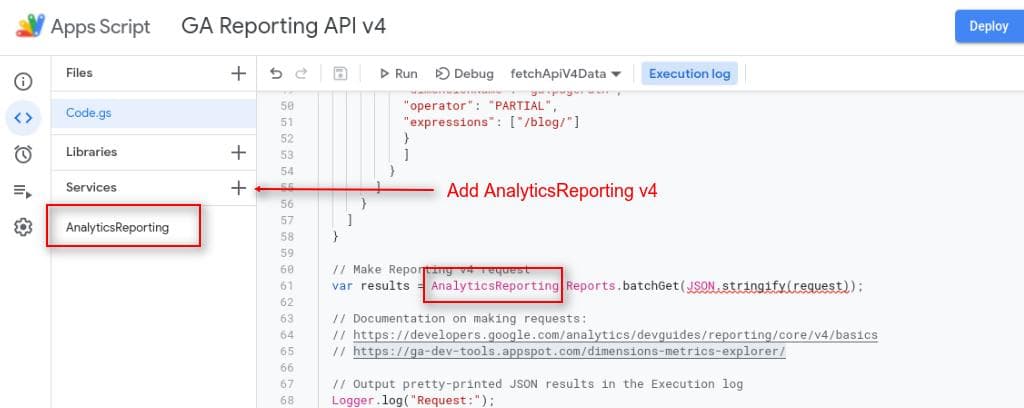
The example script provided above relies on the precence of the AnalyticsReporting object.
In order to add the AnalyticsReporting object to the Script Editor for your own projects, in the Script Editor use Services + to add the Analytics Reporting v4 service to your project:
Further examples
Filtering by dimension
Below is an example request object to fetch unique Page views, filtered to only those with pagePath including /blog/
      var request = {
           "reportRequests": [{
     		"viewId": '44232026',
     		"dateRanges": [{
     			"startDate": '2019-01-01',
     			"endDate": '2020-12-31'
     		}],
     		"includeEmptyRows": true,
     		"metrics": [{
     			"expression": "ga:uniquePageviews"
     		}],
     		"dimensions": [{
     				"name": "ga:year"
     			},
     			{
     				"name": "ga:month"
     			}
     		],
     		"dimensionFilterClauses": [{
     			"filters": [{
     				"dimensionName": "ga:pagePath",
     				"operator": "PARTIAL",
     				"expressions": ["/blog/"]
     			}]
     		}]
           }]
      }
Google documentation on dimension filters.
Using segments
Below is an example request object to fetch organic sessions using the built in segment for returning visitors:
    var request = {
         "reportRequests": [{
    		"viewId": '44232026',
    		"dateRanges": [{
    			"startDate": '2019-01-01',
    			"endDate": '2020-12-31'
    		}],
    		"includeEmptyRows": true,
    		"metrics": [{
    			"expression": "ga:sessions"
    		}],
    		"dimensions": [{
    				"name": "ga:year"
    			},
    			{
    				"name": "ga:month"
    			},
    			{
    				"name": "ga:segment"
    			}
    		],
    		"segments": [{
    			"segmentId": "gaid::-5"
    		}]
    	}]
    }
Full list of built-in segments.
Custom segments are more complex and out of the scope of these examples, see Google documentation on custom segments.
Metric custom calculations
Below is an example request object to return a custom calculation, calculating average pageviews per user:
    var request = {
         "reportRequests": [{
    		"viewId": '44232026',
    		"dateRanges": [{
    			"startDate": '2019-01-01',
    			"endDate": '2020-12-31'
    		}],
    		"includeEmptyRows": true,
    		"metrics": [{
    				"expression": "ga:pageviews"
    			},
    			{
    				"expression": "ga:users"
    			},
    			{
    				"expression": "ga:pageviews/ga:users",
    				"alias": "Avg pageviews per user",
    				"formattingType": "FLOAT"
    			}
    		],
    		"dimensions": [{
    				"name": "ga:year"
    			},
    			{
    				"name": "ga:month"
    			}
    		]
    	}]
    }
Get in touch
Call us on +44 (0)117 325 1055
